Back
Back


Every millisecond counts when it comes to mobile app performance. The faster your app loads, the more likely users are to stick around. The Shadowfax Delivery Partner App, with more than 100,000 DAUs, faced a challenge as the app had bloated to take about 3.5 seconds to start! The goal was to trim this time down to less than 2 seconds.
2. Measuring App Start Time
According to Firebase, app start time is the duration from when the app is launched from the launcher until the first activity’s `onResume()` method is called. This duration is also reported in the logcat like so:
You can read more here. For us, Firebase startup time was the source of truth.
If you consider your app to be fully loaded at some point after the onResume is called (like after your map has been fully drawn), then you can report that point in time to the system & Firebase with Activity.reportFullyDrawn() If you’re using Perfetto, then it also visualizes startup time; more on that later.
To break down parts of the app by their start time durations, we added the @trace annotation from the Firebase perf library to the app class's onCreate() function and onCreate() & onStart() of the BaseActivity & MainActivity. Basically, measuring everything on a top level so we get to know the main culprits & drill down from there.
Apart from Main & Base activities, the app class was taking 30% of the app startup time, so we did 2 things:
The application class usually initializes a lot of libraries. We moved whichever libs we didn’t need immediately on app start to init in the background with a coroutine. If you have any content providers, you can also use the Startup Library to lazy-load those.
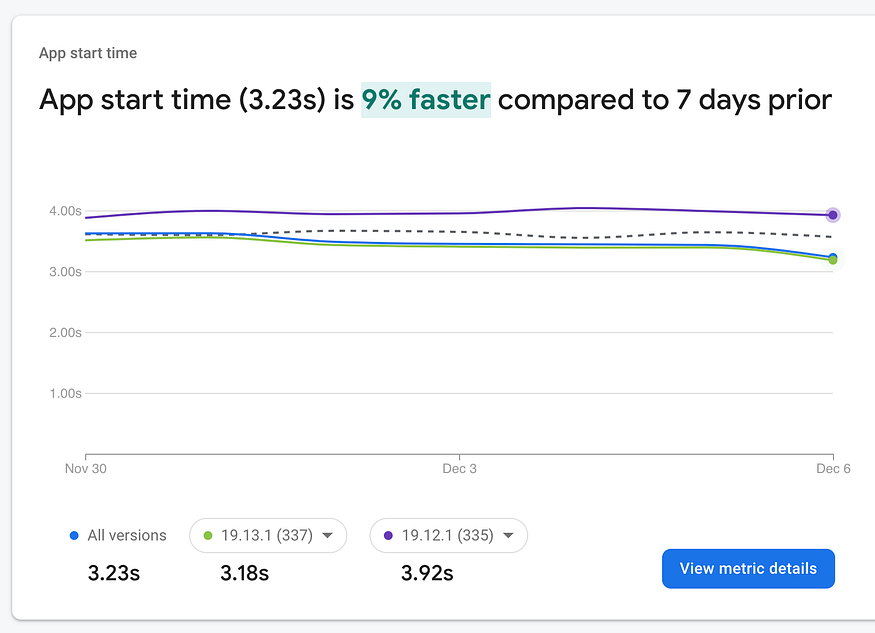
Google recommends setting up baseline profile to improve the first app startup time. We noticed a 7% overall app start time improvement. Your mileage may vary, but definitely try it out. So this was a good start, but we needed to dig deeper.
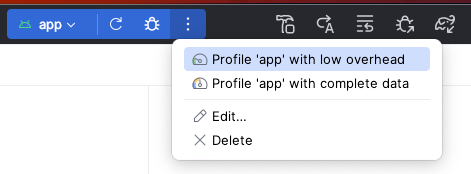
We can measure the time taken by every function by running a system trace from Android Studio, then launching the app & loading the trace into the Perfetto visualizer. We can use Android Studio’s built-in profiler, but Perfetto has better navigation & details. Details on how to do system tracing is here, but for profiling app launch time, don’t run the app normally. Here’s what you need to do:
Once you load the trace into Perfetto, don’t get scared after you encounter a gazillion colours thrown up on your screen. We don’t need to deal with all of that.
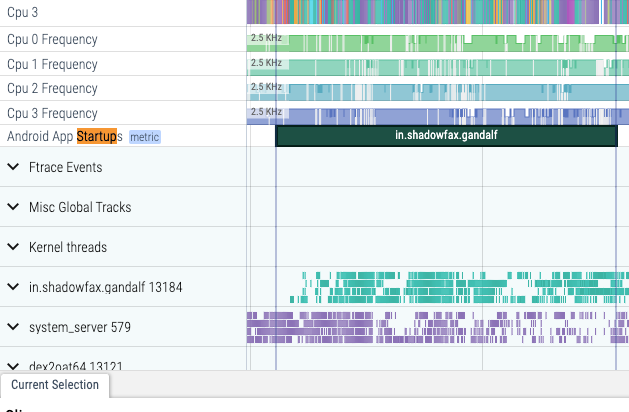
Ctrl/Cmd+F for “startup” to see the visualization of your app startup time. Click on that green bar, then press ‘M’ on your keyboard. This will mark the start & end of that bar; this is what we’re concerned about for now; everything else is just noise.
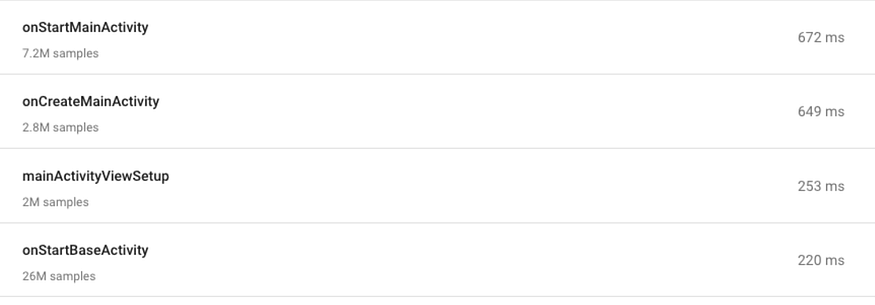
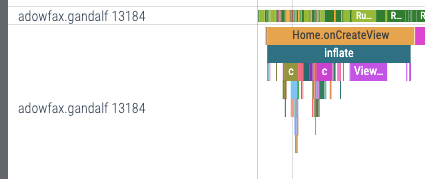
Now search for your package name below the startup time bar & click to expand it. Remember to focus on just the marked area of the graph and see the main thread; it will show you the duration of each function on the x-axis, and nested bars on the y-axis mean nested functions. Inspect the horizontally longer bars first, as those took the most time. See which of these functions took more time than expected & list them down. Then once we have the top 4–5 culprits, we can optimize them. Remember that frames should get rendered within 16 ms to achieve 60 fps.
Tip: Use WASD keys to move around. Read more about perfetto UI here. The docs are a tad bit outdated but the core principles are the same.
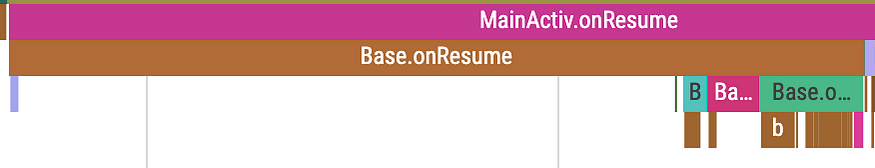
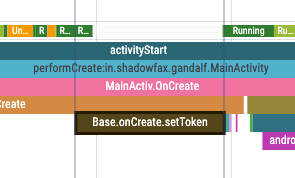
There may be functions with long durations, but nothing to show for it. Look at this looong BaseActivity onResume() bar, the graph doesn’t tell us what’s taking so long. Only at the end do we see some nested functions that account for like a fourth of its overall time. So what do we do?
We need to add more tracing. It’s easy with the tracing library available for both Java & Kotlin. Details are here, but let’s look at a snippet:
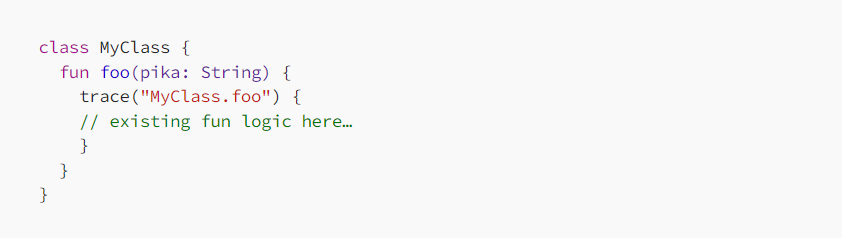
Now MyClass.foo will start showing up in Perfetto. So add tracing for all nested functions in the function you’re debugging, then re-record a trace & analyze it in Perfetto. Rinse & repeat for each lifecycle function.
This whole exercise gave us very clear root causes & targets. Now it was time to fix each of these causes one by one. Based on the observations from Perfetto and SysTrace, multiple optimizations were executed:
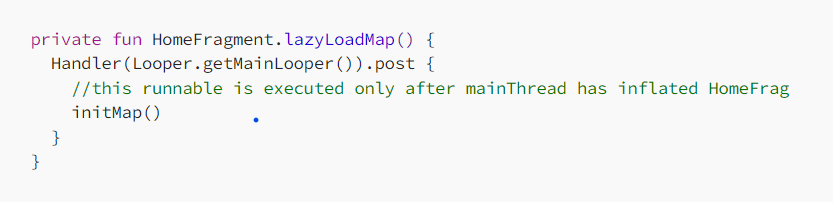
Reduced up to 600 ms by ensuring no nesting of views with Constraint Layout and using viewstubs instead of hidden views. This approach prevents unnecessary measurement & inflation of views that are hidden by default & displayed only after user interaction. Read more on view stubs. The map view, which took 200–300 ms, was moved to init only after onResume() was invoked, so it loads after the core UI showing order count & status has been laid out.
Repeated trace tests showed that LinearLayout was performing better than ConstraintLayout for our MainActivity as it was just a container for Fragments with not more than 3–4 views. In fact, switching to LinearLayout made the MainActivity start 2x faster, especially on warm starts.
Perfetto showed that a single 3rd-party SDK being initialized in MainActivity was contributing to 70% of the onCreate() duration. We started lazy-loading it in the background, as it was not required immediately on app start.
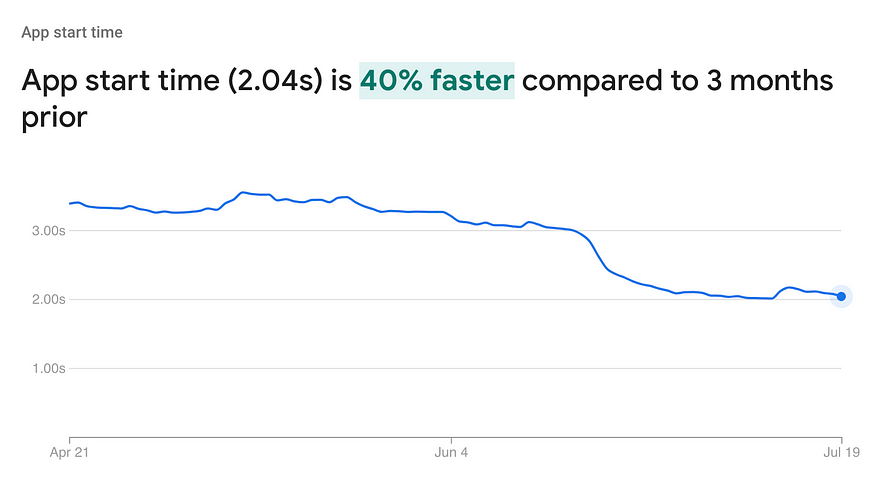
After releasing these solutions over several releases, we saw the 90th percentile of start-up time gradually go from 3.5 seconds to just under 2 seconds, a remarkable 42% reduction. We continue to look for more bottlenecks & work on speeding up the app to help make our partners more productive. Finding bottlenecks with Perfetto was crucial to this project & gave us the confidence to fix them, as we knew how much of a performance gain we’d achieve from fixing each issue.
Hash Tags :
#shadowfax #shadowfaxapp #androidapp #flashapp #shadowfaxflashapp
Related Blogs